Introduction
Dwight Howard born in Atlanta in 1985, 211 cm by 120kg, was selected as the first choice in the 2004 NBA Draft by the Orlando Magic, passing directly from high school to the top league, by many he was considered the legitimate heir of Shaquille O’Neal.
From the first game he stood out with 12 points, 10 rebounds, 4 blocks, 3 steals and 2 assists against the Milwaukee Bucks; immediately demonstrating to have great explosive strength, position under the basket in both offensive and defensive phases and a great ability to take rebounds. He finished the rookie season with an average of 12 points, 10 rebounds and 1.7 blocks.
The mighty American center becomes more and more the star of the Magic dragging the team. In the 2008-09 season he recorded 20.6 points, 13.8 rebounds and 2.9 blocks per game. He stands out by taking 1093 rebounds, dragging the team game after game, and setting record after record; become the youngest player in the league to reach 5,000 rebounds, to be the first on the block table and to earn the Defensive Player of the Year award. With these fantastic numbers, great determination and commitment on the field, he drags his Orlando Magic to the Finals against the Lakers; plays an excellent series, but in five races the yellow-purple with Kobe Bryant at the helm win the series and tie the NBA title of the 2008-09 season.
In subsequent seasons he always keeps his averages high, always reaching the Playoffs with the exception of the last season in white and blue in 2012, the year in which the center declares its desire to change team mid-season.
During his career with the Orlando Magic, Howard collects many personal accolades:
• Nba Defensive Player of the Year Award 2009,2010,2011;
• Best Nba Rebounder years 2008, 2009, 2010,2012;
• All-NBA Team Third Quintet 2007;
• All-NBA Team First Quintet years 2008, 2009, 2010, 2011, 2012;
• Best NBA stopper 2009,2010;
• All-Defensive Team Second quintet year 2008;
• All-Defensive Team First quintet years 2009, 2010, 2011, 2012;
• Best in 2010 NBA shooting rate;
• All-Star Game calls 2007, 2008, 2009, 2010, 2011, 2012;
• Record of total dunks in the 2005-06 season;
• Best regular season rebounder in 2006, 2007, 2008, 2009, 2010, 2012;
• Record of blocks in a match of the 2009 Finals;
• NBA Slam Dunk Contest year 2008;
• Becomes Orlando Magic’s all-time top scorer in 2012.
During the summer of 2012, following a very long negotiation, on August 10 he joined the Los Angeles Lakers in a deal that involved four rosters; Orlando Magic, Los Angeles Lakers, Denver Nuggets and Philadelphia 76ers. The arrival of Howard and Steve Nash gave the yellow-violet the title of “favorites” to the final victory. The season did not go as expected, the roster of great potential never became a “team”, after only 5 games the coach Mike Brown was replaced by Mike D’Antoni with whom the team struggled to get in tune, Kobe Bryant at at the start of the playoffs he injured his Achilles tendon, and finally the Lakers went out in the first round easily eliminated by the San Antonio Spurs 4-0.
From here on the career of the talented American center began to have a frenetic trend passing from: Houston rocket (2013-2016), Atlanta Hawks (2016-2017), Charlotte Hornets (2017-2018), Washington Wizards (2018-2019) . During these moves between the various franchises, Howard’s performances have deteriorated visibly due to numerous injuries including a back injury that has haunted him since recent years in Orlando.
On July 7, 2019, at the gates of his sixteenth NBA season, he surprisingly signs an unsecured minimum wage contract with the Los Angeles Lakers, thus returning to the “City of Angels”. He plays 69 games in the Regular Season finding more and more space in the yellow-violet rotations, proving to have returned to his standards and to have become much more dynamic in both phases of the game. The Lakers reach the Playoffs (which will be played in a special location; due to Covid-19 the NBA has created “Bubble” inside Disneyland, a place inaccessible to the public, where only the rosters and technical staff are located, all in a special city for Howard, that is, Orlando) and he plays 18 games showing off race after race, earning a place in the starting five in the final series against the Miami Heat won 4-2, so for the first time in his career he wins the NBA Champion trophy.
Tactical Analysis and Statistics
Tactical Analysis
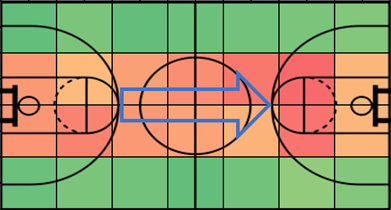
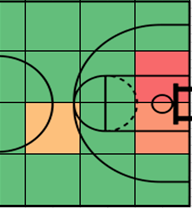
The tactical analysis begins with the Heat Maps that show the areas more or less traveled by the player during the Finals, everything is represented with a scale of colors ranging from green for the less occupied areas, up to red for the most occupied areas.
Graph 1
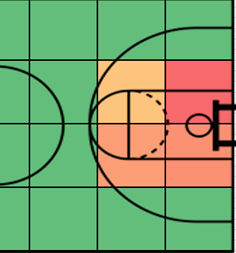
Graph 1 shows the areas of the pitch occupied during the five games of the Finals series of 2008-09, when the center wore the Magic shirt against the Lakers. As we can see, his defensive or non-possession game took place mainly in the area below the basket, particularly on the right side (with an eye towards the opponent’s basket). While as far as the offensive or possession phase is concerned, also in this case it took place in the central area of the field, in particular between the free throw line and the basket. The red areas near the opponent’s free throw bezel are highlighted because they are the areas where Howard mostly stationed to carry blocks (the blocks carried during the series were 341) creating pick and roll situations (which he exploited) or penetration. for his teammates. With reference to this phase of the game, a Heat Map (Graph 2) is shown below to highlight the areas from which the player has shot.
Graph 2
As you can see, the shots are concentrated in the area defined in basketball jargon as “painted”. 62 shots were taken for the basket during this series, of which 24 were made (8 with the left hand, 11 right hand and 5 dunks, of the latter two in alley-oop).
Graph 3
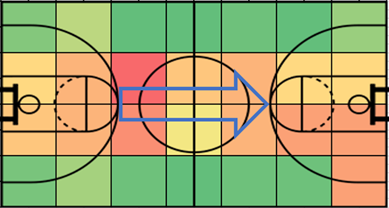
Graph 3 shows the field areas covered during the Finals series (6 games) played by the Lakers against the Miami Heat during the 2019-20 season. From this Heat Map you can see how in the defensive phase the graph becomes red in the central area of the field but no longer under the basket but on the perimeter of the three-pointer area, and in light green two areas are highlighted along the sides of the field always around at the edge of the three-pointer area; This is because Howard has become a much more dynamic and quick player, thus being able to make sudden changes of marking with his teammates, and by coupling with opponents of different roles, for example during the Finals he found himself marking in some game situations Iguodala ( Small Forward) or star Jimmy Butler (Guard / Small Forward). But the areas occupied in the defensive phase are not only the result of the physical and technical-tactical improvements of the American center, but are also a consequence of the different way of playing of the “Centers” in modern basketball; now talking about roles in modern basketball, in particular the NBA, turns out to be an old-fashioned thing as modern big shots are required to have good skills in dribbling, changing direction and why not even shooting from a distance. So Howard found himself marking his opponent, Adebayo, Leonard or Olynyk, no longer in the area under the basket as happened with Bynum (Los Angeles Lakers center 2008-09).
In the offensive or possession phase as we see in Graph 3, it covers almost all the areas within the opponent’s area, especially in the space adjacent to the baseline on the side of the basket. This position is the starting situation in the game of the “new” Dwight Howard, naturally dictated by the position of his teammates; Anthony Davis almost always left in isolation with a defensive doubling, Lebron James to manage the maneuver by fielding all his physical and technical-tactical baggage, and two guards with different characteristics, Danny Green shooter and Caldwell-Pope more inclined to penetrating baskets but that in the last season he played also showed a good shot from the arch.
Graph 4
The areas highlighted in Graph 4 indicate the areas from which Howard shot in the six games of the final series against Miami; we can see how the shots come from three macro-areas, this is because as explained later in the section concerning the statistics, 63% of the shots made were crushed (almost exclusively in alley-oop). Finally, an area in yellow near the 7.25 meter arc, this is because Howard in Game 6, the last game of the 2019-20 Finals, ended his season with a three-pointer (the result of an evolutionary process from a technical point of view, on which the player is working in the NBA off-season phases).
Regular Season Statistics Comparison
In this first section of the analysis, the goal is to compare Dwight Howard’s statistics collected during the regular season, taking into account three seasons of the NBA championship: 2008-09, 2012-13, 2019-20.
| % 2PT ATTEMPTED | % 2PT SCORED | % 3PT ATTEMPTED | % 3PT SCORED | % OFF. REBOUNDS | % DEF. REBOUNDS | % REBOUNDS | OFF. RATING | DEF.RATING | |
| ORL 2008-09 | 99,8 | 69.0 | 0.2 | 0.0 | 12.6 | 26.2 | 19.6 | 110.3 | 100.3 |
| LAK 2012-13 | 99,3 | 72.4 | 0.7 | 0.2 | 9.4 | 24.4 | 17.2 | 106.3 | 103.4 |
| LAK 2019-20 | 98,2 | 77.0 | 1.8 | 1.7 | 12.8 | 25.7 | 19.1 | 112.3 | 106.4 |
Table 1
The graphs with which the data were compared and therefore the performance of the US center are shown below.
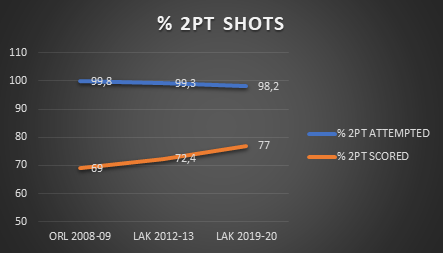
Graph 5
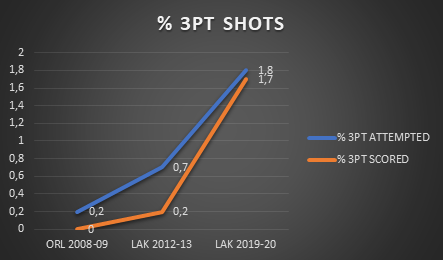
The graph above shows the comparison between the percentage values of the two-point shots taken (in blue) and those marked (in orange); as you can see over time Dwight Howard has reduced the number of shots made, instead increasing the number of shots scored, this suggests that he has changed his tactical attitude in attack and improving the quality of the shot, consequently increasing the percentage of points scored . With regard to this improvement in shooting, it is important to underline how he introduced the three-point shot (percentages represented in Graph 5) to his technical repertoire, in the past this was a fundamental totally absent (the addition of the three-point shot, together with other technical-tactical measures that we will see later in the analysis, make his way of playing more modern and suitable for current basketball).
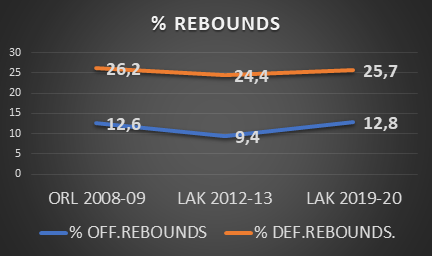
Graph 6
A fundamental technical strong point of the current Los Angeles Lakers center is the rebound; He has long been the best in the league for rebounds collected, although during the years between his last season in Orlando and his return to the Los Angeles Lakers in 2019, the number of rebounds dropped sharply. In the season just ended in the Orlando “Bubble”, he concluded the Regular Season returning to percentage values very similar to those of his best season in Orlando (Graph 7 and Graph 8), that is 2008-09 when he took the Magic to the final against the Lakers.
Graph 7
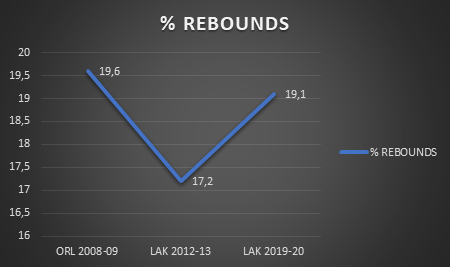
Graph 8
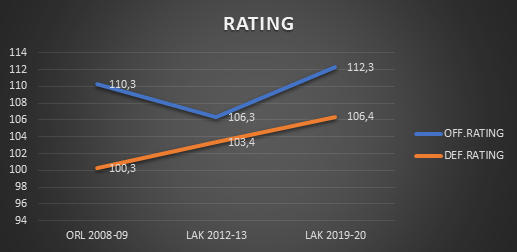
The NBA in its “NBAStats” statistical database, which is updated every year match after match, contains numerous data for each individual player, and with an algorithm calculates the evaluation for each player in the offensive and defensive phase; analyzing Howard’s data in the three seasons taken into consideration, we see how in the 2019-20 season (35 years) he achieved even better results than in the 2008-09 season (24 years).
Graph 9
Finals Statistics Comparison
In this first section of the analysis, the goal is to compare Dwight Howard’s statistics collected during the Finals he played during his NBA career during the seasons: 2008-09, 2019-20.
| % 2PT ATTEMPTED | % 2PT SCORED | % 3PT ATTEMPTEDI | % PUNTI TIRI 3 PT | % OFF.REBOUNDS | % DEF.REBOUNDS | % REBOUNDS | OFF.RATING | DEF.RATING | |
| ORL 2008-09 | 99.3 | 69.0 | 0.7 | 0.0 | 11.8 | 21.0 | 21.0 | 104.5 | 104.8 |
| LAK 2012-13 | 100 | 76.5 | 0.0 | 0.0 | 8.2 | 28.0 | 17.9 | 91.7 | 112.1 |
| LAK 2019-20 | 96.5 | 73.1 | 3.5 | 2.9 | 11.5 | 18.6 | 15.0 | 113.0 | 113.3 |
Table 2
Graph 10
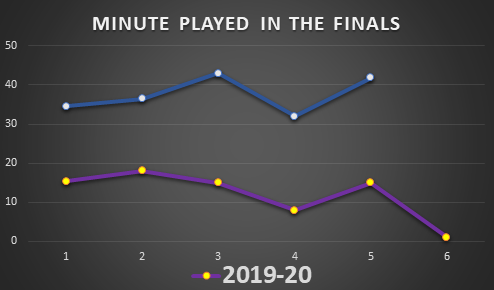
The first graph taken into consideration is descriptive, it demonstrates how the Los Angeles Lakers’ rotation time in the 2019-20 Finals is lower than in the 2008-09 season at the time of the Orlando Magic; however, we can see how the trend of the line representing the time is very similar from Race 1 to Game 5, with a greater time during the first two races, which decreases in the fourth races, and then goes back to Game 5.
| 2PT SHOTS (ORLANDO MAGIC) | 2PT SHOTS (LOS ANGELES LAKERS) | |
| GAME 1 | 10 | 1 |
| GAME 2 | 13 | 4 |
| GAME 3 | 12 | 2 |
| GAME 4 | 15 | 0 |
| GAME 5 | 12 | 1 |
| GAME 6 | 0 |
Tabs 3
Graph 11
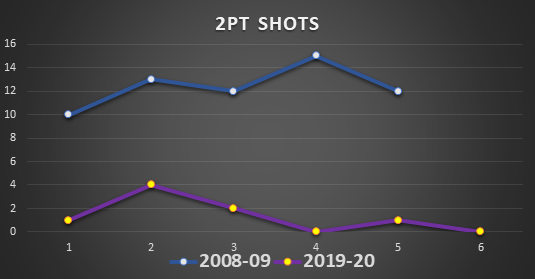
Table 3 and Graph 7 show the values of the number of two-point attempts made during the Finals of 2008-09 (blue-white) and 2019-2020 (yellow-purple), it can be seen that he made many shots less in the last few games played, but in Graph 10 and Graph 11 you can see how the effectiveness of the shots made at the time of the Magic is much lower.
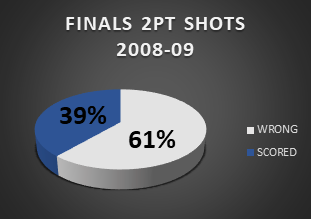
Graph 12
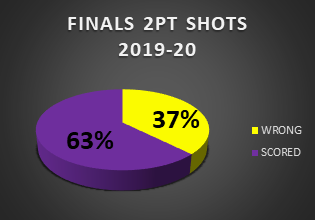
Graph 13
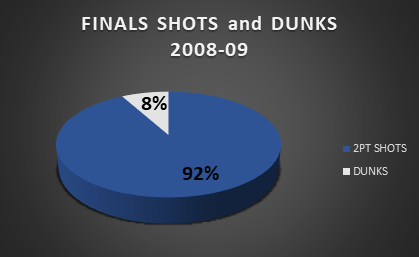
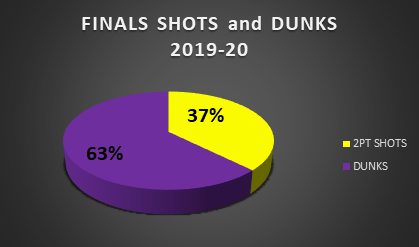
Furthermore, in Graph 13 it is highlighted how in the series against the Miami Heat of 2019-20, the shots attempted by Howard are almost all dunks, this is because his way of playing in the offensive phase has changed a lot, as described in the section on the analysis. player tactics.
Graph 14
Graph 15
The graphs, the Heat maps, and the data collections were created by the Match Analyst Alessandro Imbrogno, as regards the data on the regular season 2008-09 and 2019-20, the data were extrapolated by NBAStats.
Edited by
Sport Scientist & Match Analyst
Alessandro Imbrogno

Commenta con Facebook